Top 10 Cities for CIO Pay versus Cost of Home
Salaries for top paid CIO positions are often based on housing and compensation of other CIOs in the same area, industry and size of IT organization
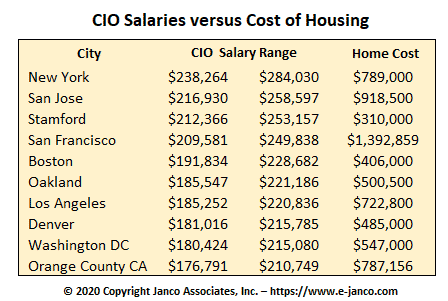
 The salaries paid to top level CIOs is determined by a number of factors. One of the key factors is the metropolitan area where the CIO and his/her organization reside. In Janco's IT Salary Survey we identified the top 10 cities for CIO compensation. New York City, San Jose, Stamford, and San Francisco topped the list with annual salaries over $200,000.
San Jose and San Francisco were the most expensive places to live with median home cost between $918,500 and $1,392,859. At those levels of compensation and housing cost it is almost impossible to find candidates willing to move there with major incentives.
Data is available on all positions by for 78 US cities and 23 selected cities in Canada.
Statistics Presented by City
The IT salary survey presents the numerical results in a tabular fashion. Shown are the normalized minimum and maximum for the base salary, as well as the total compensation (including supplemental compensation) for each position, as well as Janco’s own benchmark. The remaining columns show figures for 78 typical United States metro areas, as well as 24 selected metro areas in Canada, with adjustments made on the basis of such factors as cost of living, local economic indicators, and regional industry forecasts. City data includes perks. US cities data is in US dollars and Canadian cities data is in Canadian Dollars.
The Compensation Study data is divided into two categories. Large companies are companies whose gross revenues are equal to or greater than $500 MM or more than 1,000 total employees. Mid-sized companies are companies whose gross revenues are less than $500 MM and less than 1,000 employees
All salaries are normalized to a national standard, taking into account the cost of living in the metropolitan areas presented. Note some metro areas may not have sufficient data points to be statistically accurate to plus or minus 5%. However, all of the national numbers are statistically valid for plus or minus 1.2%
Order Salary Survey Download Sample Provide Data
Janco produces this survey twice a year - January and June. The data is provided by the participating organizations the the understanding that no identifying information will be provided and that all data is aggregated.